


Clubby Dashboards
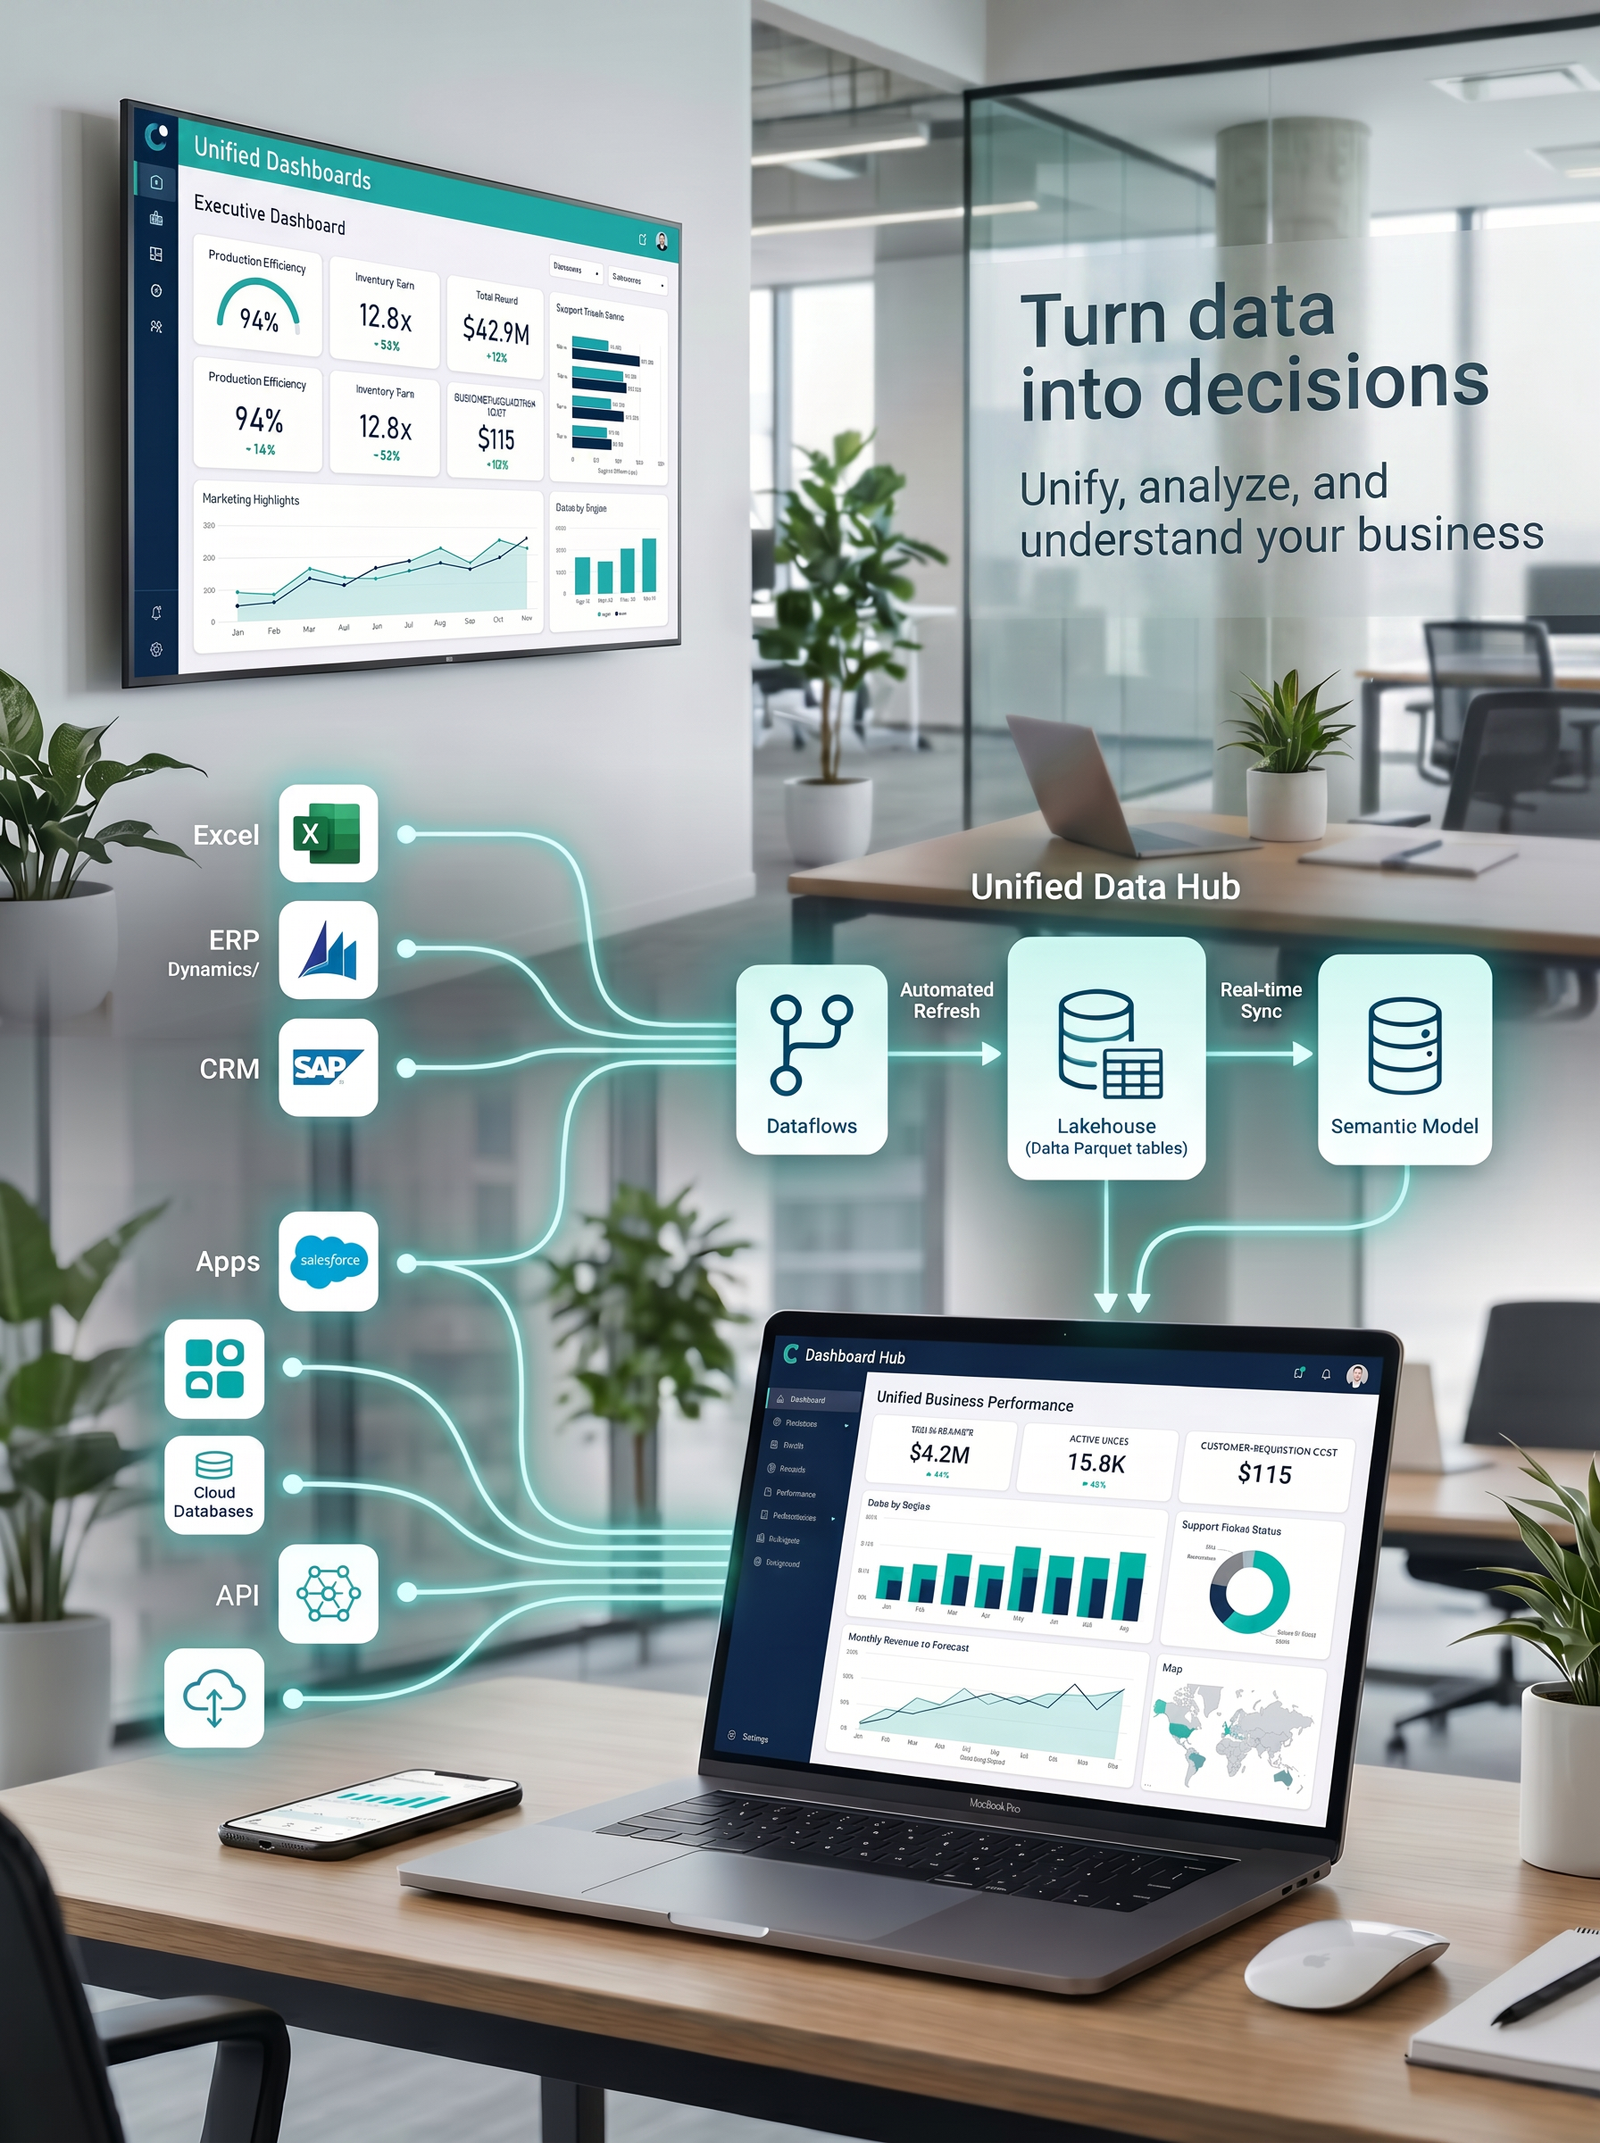
Turn your business data into actionable dashboards.
Clubby Dashboards helps businesses unify data from Excel, ERP, CRM, apps, databases, APIs, and operational systems, then transform it into Power BI dashboards and Microsoft Fabric data models that support better decisions.
From data sources to business decisions
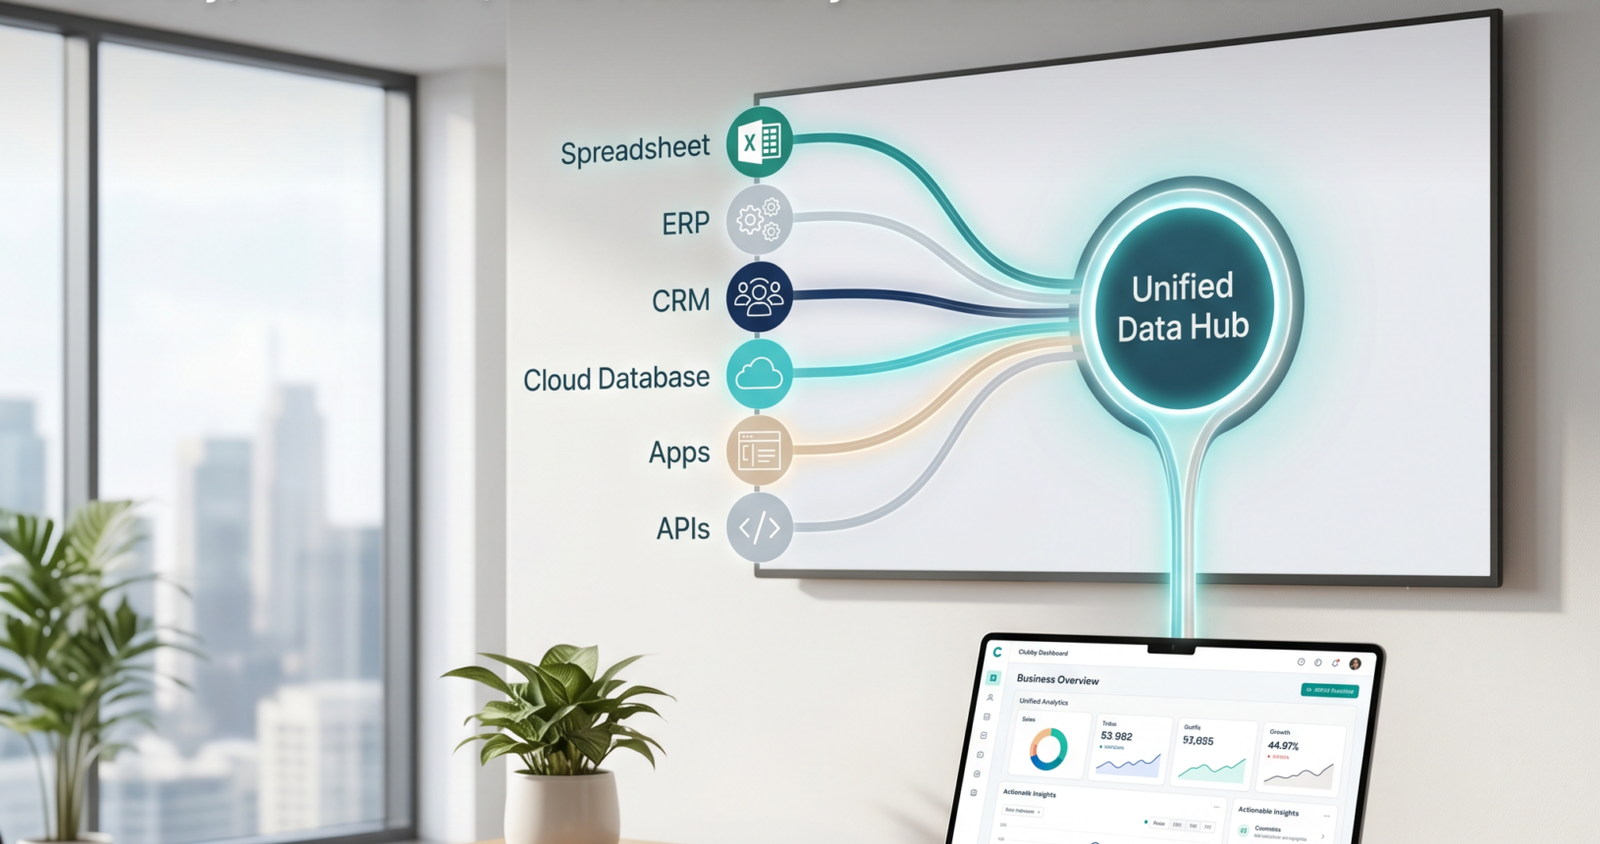
Unify your data
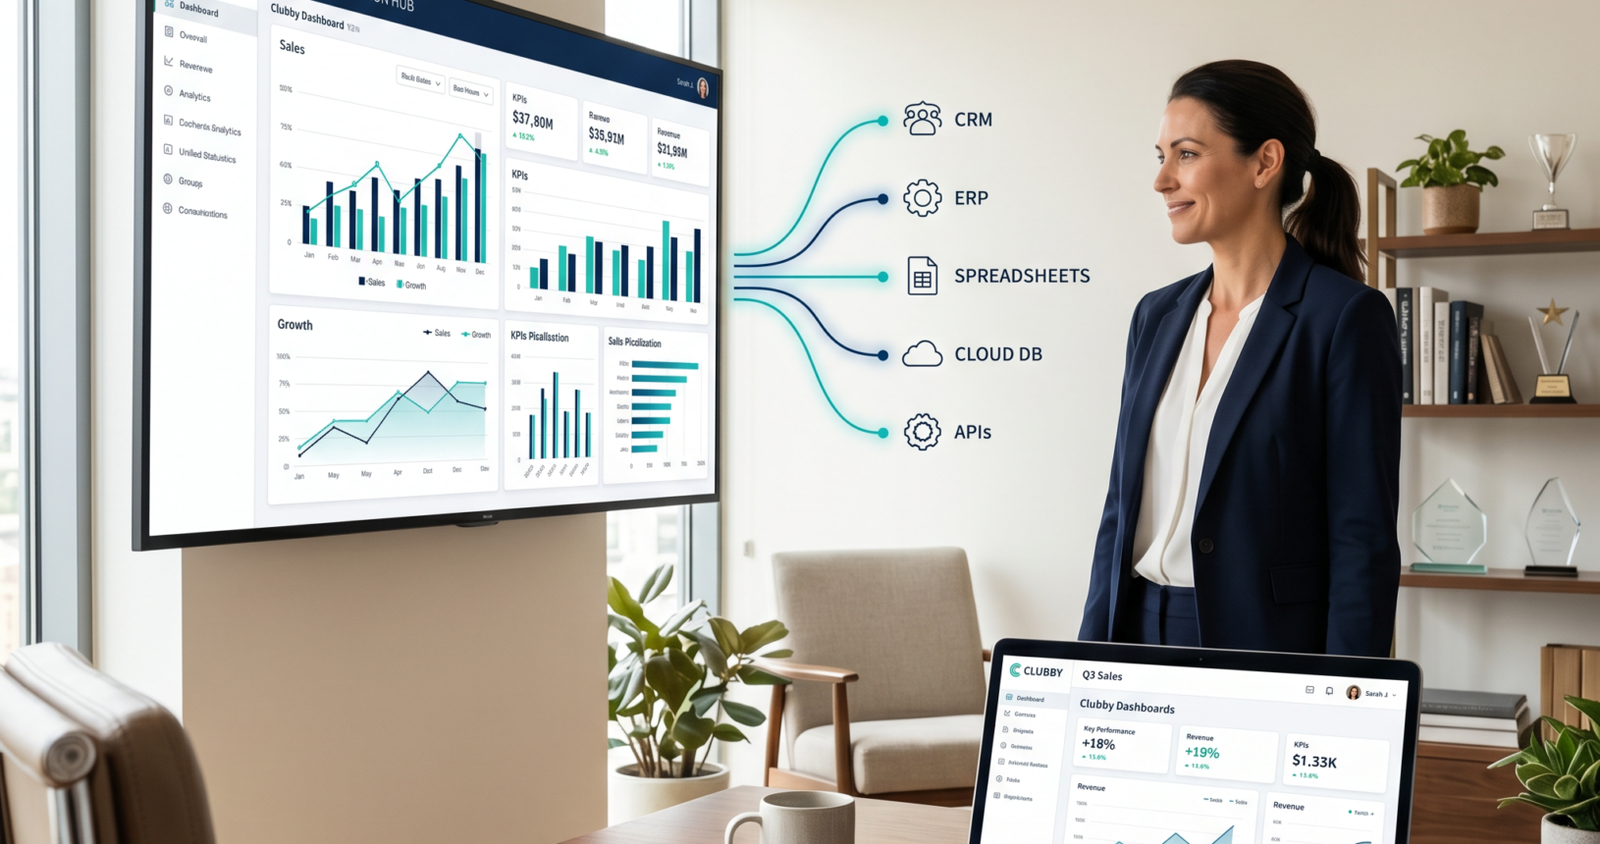
Connect Excel, ERP, CRM, apps, databases, APIs, and operational files into a clearer reporting structure.
Transform the model
Clean, normalize, prepare, and model your data with dataflows, semantic models, KPIs, and refresh logic.
Visualize insights
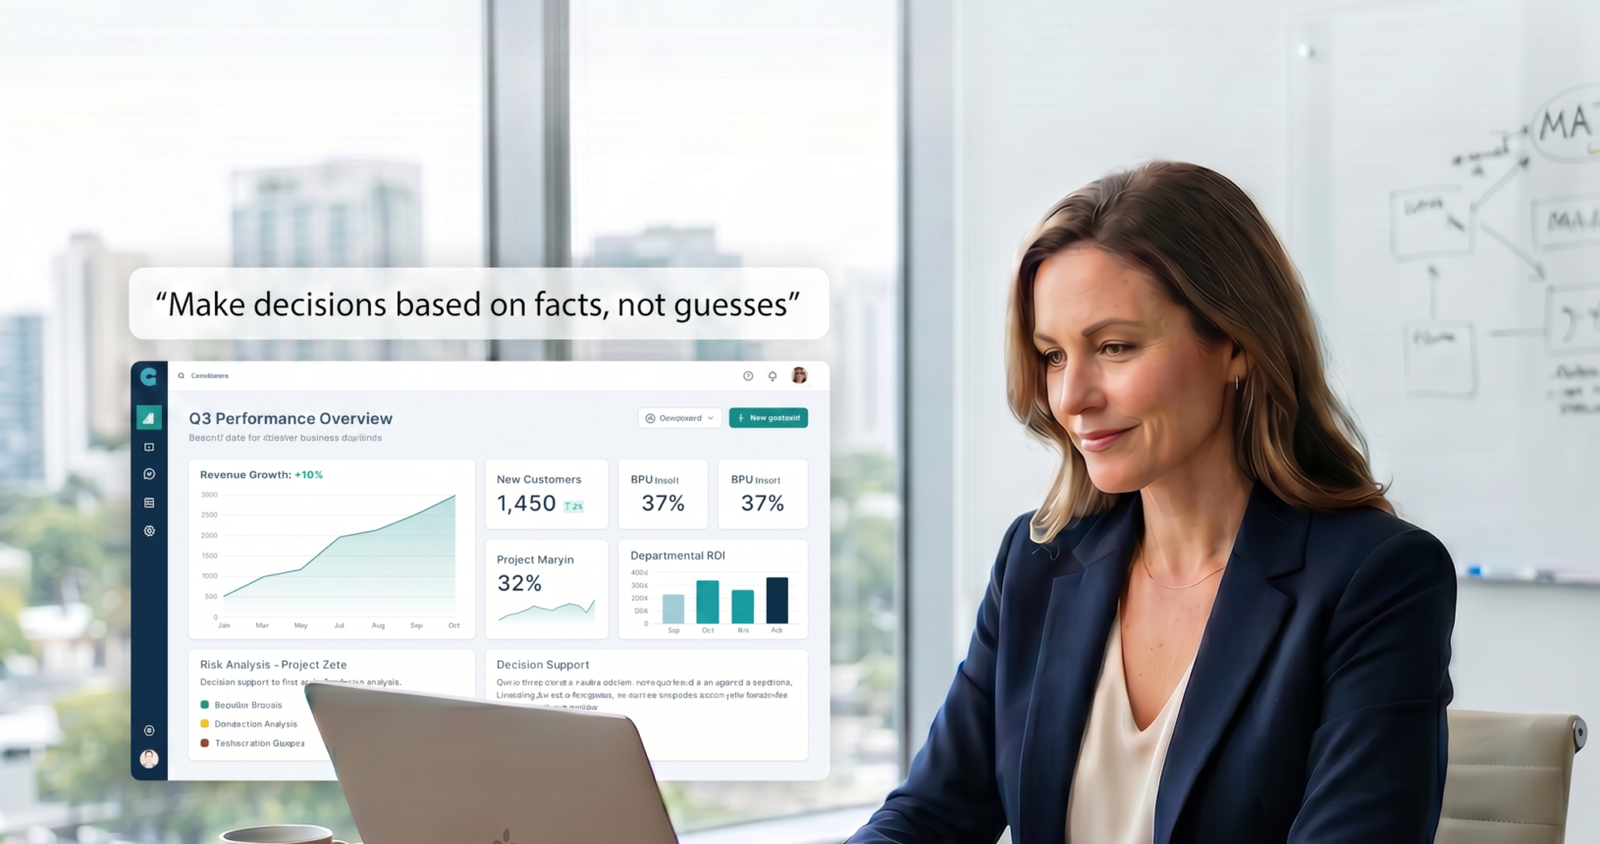
Build Power BI dashboards that help leaders understand sales, operations, finance, customers, and performance.
What We do
Clubby designs the full data journey, from business questions and raw sources to automated dashboards, executive KPIs, and ongoing BI support. The goal is not only to create reports, but to help your business understand what is happening and what to do next.
- Data discovery and KPI definition: We identify your business goals, decision needs, stakeholders, KPIs, current reports, and data quality challenges.
- Data source integration: We connect and structure data from Excel, Google Sheets, ERP, CRM, SQL databases, APIs, files, payment platforms, apps, and operational systems.
- Dataflows and transformation: We clean, transform, normalize, refresh, and prepare your data so it can support reliable dashboards and recurring analysis.
- Microsoft Fabric and semantic models: We can design lakehouse structures, semantic models, relationships, DAX measures, calendar tables, hierarchies, RLS, and optimized BI layers.
- Power BI dashboards and visualizations: We build executive, financial, commercial, operational, inventory, customer, productivity, and service-performance dashboards.
- BI as a Service and ongoing support: Clubby can support refresh monitoring, dashboard improvements, monthly reviews, new metrics, data quality checks, and future analytics needs.